This tutorial provides a step-by-step guide to extracting and visualizing driving paths in a specified location using Python’s OSMnx and NetworkX libraries. Learn how to compute the shortest paths between points, convert graph data into geospatial formats, and export the results as GeoJSON files for further analysis.
Tutorial Content:
Introduction
Working with geospatial data is crucial for transportation analysis, urban planning, and navigation systems. This tutorial will guide you through creating a driving graph for Urmia, Iran, identifying the shortest paths between two points, and exporting the graph’s geometry for further analysis.
Prerequisites
Before starting, ensure you have the following libraries installed:
osmnxnetworkxshapelygeopandas
You can install them using:
pip install osmnx networkx shapely geopandas
Step 1: Generate a Driving Graph
We begin by importing OSMnx and creating a graph for the driving network in the target area:
import osmnx as ox

place_name = 'Urmia, Iran'
G = ox.graph_from_place(place_name, network_type='drive')
Step 2: Define Origin and Destination
Next, specify the coordinates for the origin and destination points:
Origin_point = (45.064459, 37.544101)
Destination_point = (45.070896, 37.568596)

origin_node = ox.distance.nearest_nodes(G, X=Origin_point[0], Y=Origin_point[1])
dest_node = ox.distance.nearest_nodes(G, X=Destination_point[0], Y=Destination_point[1])
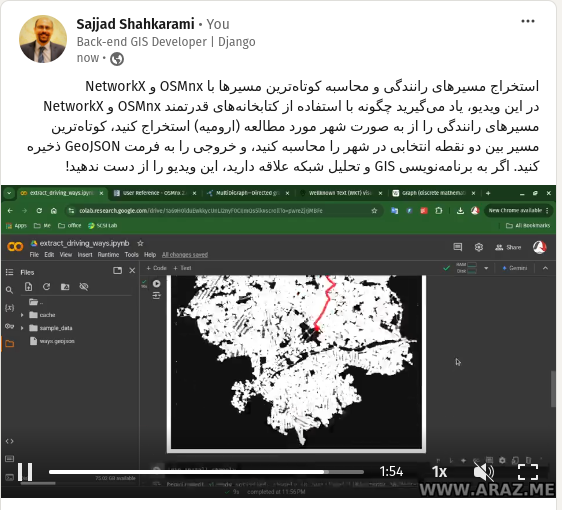
Step 3: Find and Visualize Shortest Paths
Compute the two shortest paths between the origin and destination nodes and visualize them:
import networkx as nx

k_paths = list(ox.routing.k_shortest_paths(G, origin_node, dest_node, k=2))
fig, ax = ox.plot_graph_routes(G, k_paths)

for i, path in enumerate(k_paths):
    length = sum(nx.shortest_path_length(G, path[i], path[i + 1], weight="length") for i in range(len(path) - 1))
    print(f"Path {i + 1} length: {length} meters")
Step 4: Extract and Export Driving Ways
Convert the graph’s geometry into LineStrings and save it as a GeoJSON file:
from shapely.geometry import LineString
import geopandas as gpd

def graph_to_linestring(G):
    linestring = []
    for u, v, data in G.edges(data=True):
        if 'geometry' in data:
            linestring.append(data['geometry'])
        else:
            try:
                linestring.append(LineString([(G.nodes[u]['x'], G.nodes[u]['y']), (G.nodes[v]['x'], G.nodes[v]['y'])]))
            except KeyError:
                continue
    return linestring

ways = graph_to_linestring(G)
gdf = gpd.GeoDataFrame(geometry=ways)
gdf.to_file('ways.geojson', driver='GeoJSON')
Conclusion
This tutorial demonstrates how to use Python for extracting and visualizing driving routes from OpenStreetMap data. The exported GeoJSON file can be further analyzed or visualized in GIS software.
Next Steps
You can extend this tutorial by:
- Analyzing different routing metrics (e.g., travel time, congestion).
- Implementing a web application to interact with the extracted routes.
- Exploring similar workflows for other network types, such as walking or cycling.