Understanding the spatial distribution of facilities like schools is crucial for urban planning and decision-making. In this post, we’ll walk you through how to use Python to perform a Kernel Density Estimation (KDE) analysis and visualize the results interactively.
Why Kernel Density Estimation?
KDE is a statistical method used to estimate the probability density function of a random variable. In spatial analysis, it helps us identify clusters and hotspots of data points, making it an excellent tool for analyzing the distribution of facilities like schools.
What You’ll Learn
- Extracting spatial data using OSMNx
- Using GeoPandas for geospatial data manipulation
- Performing KDE analysis with Scipy
- Visualizing results with Matplotlib and Folium
Step 1: Extracting Data
We’ll use OSMNx to fetch the locations of schools in Tehran. The extracted data is then converted into a GeoJSON file for further processing.
import osmnx as ox
import geopandas as gpd

place_name = 'Tehran, Iran'
tags = {'amenity': 'school'}

schools_gdf = ox.features_from_place(place_name, tags)
schools_gdf['geometry'] = schools_gdf['geometry'].centroid
schools_gdf.to_file('schools.geojson', driver='GeoJSON')
Step 2: KDE Analysis
Using Scipy‘s gaussian_kde, we calculate the density of schools across Tehran and create a heatmap of these densities.
from scipy.stats import gaussian_kde
import numpy as np
import matplotlib.pyplot as plt

coords = np.vstack((schools_gdf.geometry.x, schools_gdf.geometry.y))
kde = gaussian_kde(coords)

x_min, x_max = schools_gdf.geometry.x.min(), schools_gdf.geometry.x.max()
y_min, y_max = schools_gdf.geometry.y.min(), schools_gdf.geometry.y.max()
x_grid = np.linspace(x_min, x_max, 100)
y_grid = np.linspace(y_min, y_max, 100)
x_mesh, y_mesh = np.meshgrid(x_grid, y_grid)

kde_values = kde(np.vstack([x_mesh.ravel(), y_mesh.ravel()])).reshape(x_mesh.shape)
We then visualize the results with Matplotlib:
plt.figure(figsize=(10, 10))
plt.imshow(kde_values, extent=(x_min, x_max, y_min, y_max), origin='lower', cmap='viridis', alpha=0.5)
plt.colorbar(label='Density')
plt.scatter(schools_gdf.geometry.x, schools_gdf.geometry.y, color='red', s=10, label='Schools')
plt.title('Kernel Density Estimation of Schools in Tehran')
plt.xlabel('Longitude')
plt.ylabel('Latitude')
plt.legend()
plt.show()
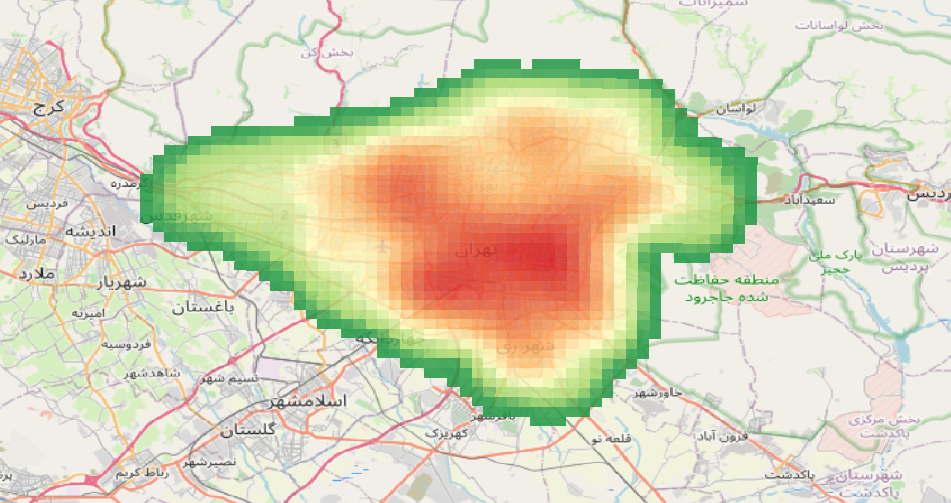
Step 3: Interactive Map
Finally, we create an interactive map using Folium to visualize the schools and KDE results.
import folium

m = folium.Map(location=[(y_min + y_max) / 2, (x_min + x_max) / 2], zoom_start=12)
for idx, row in schools_gdf.iterrows():
    folium.CircleMarker(
        location=(row.geometry.y, row.geometry.x),
        radius=10,
        color='red',
        fill=True,
        fill_color='red',
        fill_opacity=0.6,
        popup=row.get('name', 'School')
    ).add_to(m)
# m.save("schools_kde_map.html")
m
Key Takeaways
This tutorial demonstrates how Python’s rich ecosystem of libraries simplifies geospatial analysis. KDE is just one of many techniques to extract insights from spatial data. The generated density maps can guide decisions like allocating resources or planning new schools.