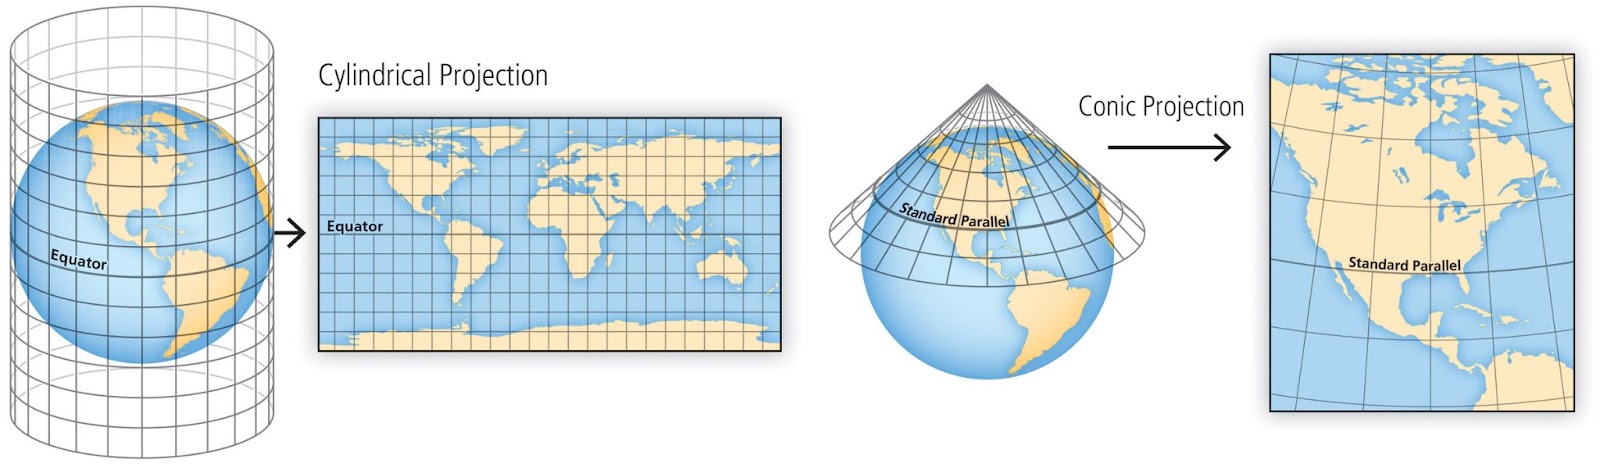
Map projections are methods used to represent the three-dimensional surface of the Earth on a two-dimensional plane. In Python, several libraries can be used to work with map projections, such as Matplotlib, Cartopy, and Basemap. Below, I’ll provide an overview of how to use Cartopy, a popular library for geospatial data visualization, to create a simple map with different projections.
Installation
If you haven’t already installed Cartopy, you can do so using pip. You may also need to install additional dependencies, such as shapely, geos, and proj.
    bash


  pip install cartopy
Example: Creating Maps with Different Projections
Here’s a step-by-step example of how to create maps using different projections with Cartopy.
    python


  import matplotlib.pyplot as plt
import cartopy.crs as ccrs

# Create a list of projections to demonstrate
projections = [
    ccrs.PlateCarree(),  # Geographic projection
    ccrs.Mercator(),     # Mercator projection
    ccrs.Orthographic(),  # Orthographic projection
    ccrs.LambertConformal(),  # Lambert Conformal projection
]

# Set up the figure and axes
fig, axs = plt.subplots(nrows=2, ncols=2, subplot_kw={'projection': projections[0]})
axs = axs.flatten()  # Flatten the 2D array of axes

# Define a title for each projection
titles = ['Plate Carree', 'Mercator', 'Orthographic', 'Lambert Conformal']

# Loop through each projection and create a map
for ax, proj, title in zip(axs, projections, titles):
    ax.set_global()  # Set the extent to global
    ax.coastlines()  # Add coastlines
    ax.set_title(title)  # Set the title for the subplot

    # Optionally, you can add additional features, like borders or gridlines
    ax.add_feature(cartopy.feature.BORDERS)
    ax.gridlines()

# Adjust layout and show the plot
plt.tight_layout()
plt.show()
Explanation of the Code
- Importing Libraries: We import
matplotlib.pyplotfor plotting andcartopy.crsfor the different map projections. - Defining Projections: We create a list of different projections we want to demonstrate.
- Setting Up the Figure: We create a figure with subplots. Each subplot will have a different projection.
- Looping Through Projections: We loop through each projection, setting the global extent, adding coastlines, and setting titles for each subplot. We also add borders and gridlines for better visualization.
- Displaying the Map: Finally, we use
plt.show()to display the figure.
Alternative Methods
- Basemap: Another option for map projections in Python is the Basemap toolkit, but it is being deprecated in favor of Cartopy. If you need to work with legacy code or specific features of Basemap, you can look into it, but for new projects, Cartopy is recommended.
- Geopandas: If you’re working with geospatial data (like shapefiles or GeoJSON), you can use Geopandas in conjunction with Matplotlib and Cartopy for more complex visualizations.
Conclusion
Using Cartopy, you can easily create maps with various projections and add geographical features. This example demonstrates the basics, but you can extend it further by adding more features, data overlays, or customizing the appearance of your maps.