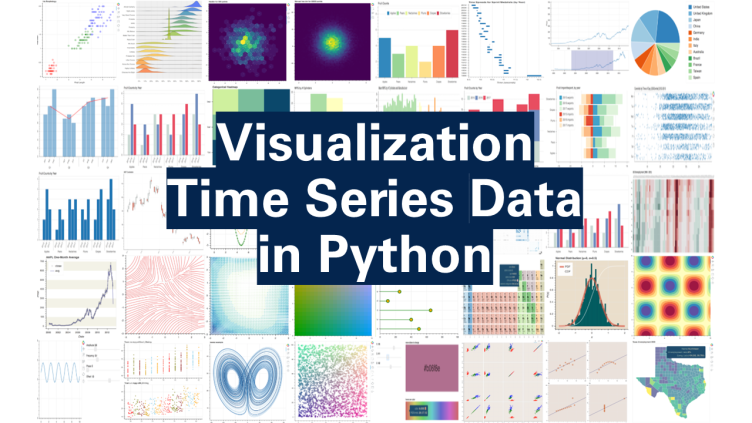
To visualize time series data in a Django web application, you can use various libraries and modules. One of the popular choices is to use a JavaScript library for interactive charting and visualization. Here are some options:
- Chart.js: Chart.js is a simple yet versatile JavaScript library for creating interactive charts and graphs. You can use it with Django by including the library in your HTML templates and passing data from your Django views to the JavaScript code that initializes the charts. Django Integration Example:
- Include Chart.js in your HTML template.
- Pass time series data from your Django view to the template using the context.
- Write JavaScript code to create and customize the charts based on the data.
- Plotly: Plotly is a powerful JavaScript graphing library that supports a wide range of chart types, including time series plots. It also offers a Python API, Plotly.py, which can be used with Django. Django Integration Example:
- Install Plotly and create interactive time series plots in your Django views using Plotly.py.
- Render the Plotly plots in your Django templates.
- Highcharts: Highcharts is a JavaScript charting library known for its flexibility and interactivity. It provides Django integration through packages like
django-highcharts. Django Integration Example:
- Install the
django-highchartspackage and use it to render Highcharts in your Django templates. - Pass time series data from your views to the template using the package’s template tags and filters.
- D3.js: D3.js is a highly customizable data visualization library that gives you full control over the rendering process. While it has a steeper learning curve compared to the other libraries, it can be a powerful choice for custom visualizations. Django Integration Example:
- Include D3.js in your HTML templates.
- Write custom JavaScript code to create time series visualizations using D3.js.
- Pass data from your Django views to the JavaScript code.
- Bokeh: Bokeh is a Python library for creating interactive visualizations, including time series plots. It has built-in support for Django. Django Integration Example:
- Install Bokeh and create interactive time series plots in your Django views.
- Use Bokeh’s Django integration to embed the plots in your templates.
Your choice of library may depend on factors like your familiarity with the library, the complexity of your visualizations, and your specific requirements for interactivity and customization. Each of these libraries has its own strengths and weaknesses, so you should evaluate them based on your project’s needs.

